Gallery of new files
From Efficiency Finder
Jump to navigationJump to search
This special page shows the last uploaded files.

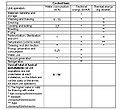
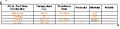
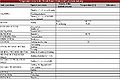
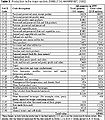
 Consumption levels for cured ham manufacturing in Italy.jpg Breka
12:21, 19 October 2010
726 × 600; 72 KB

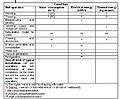
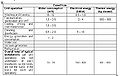
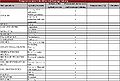
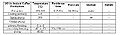
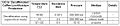
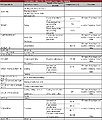
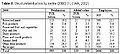
 Consumption and emission levels for cooked ham manufacturing in Italy, table.jpg Breka
12:16, 19 October 2010
656 × 600; 68 KB
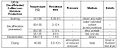
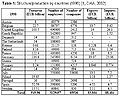
 Consumption levels for canned ham manufacturing in Italy.jpg Breka
12:11, 19 October 2010
670 × 425; 56 KB

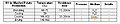
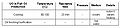
 Temperature ranges, potatoe crisps production, table1.jpg Breka
11:34, 19 October 2010
514 × 92; 12 KB

 Temperature ranges,, potatoe chips production, table1.jpg Breka
11:31, 19 October 2010
665 × 151; 19 KB

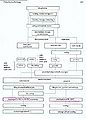
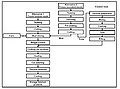
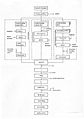
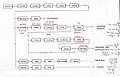
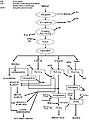
 Flowsheet of granulated potato production, figure1.jpg Breka
11:28, 19 October 2010
631 × 406; 36 KB
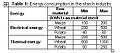
 Temperature ranges in the starch production, table1.jpg Breka
11:22, 19 October 2010
509 × 83; 11 KB
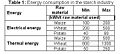
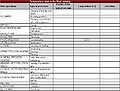
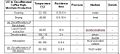
 Temperature rates in the starch production, table1.jpg Breka
11:04, 19 October 2010
830 × 544; 101 KB
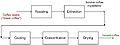
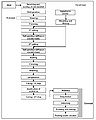
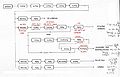
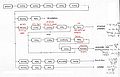
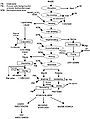
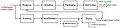 Flowsheet of decaffeinated coffee production, figure1.jpg Breka
10:43, 19 October 2010
661 × 152; 16 KB
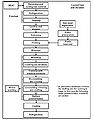
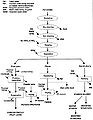
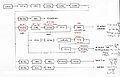
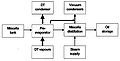
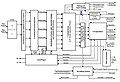 Schematic diagram of the production process in a large Danish fish-meal factory.jpg Breka
10:07, 19 October 2010
564 × 384; 33 KB

 Material flow in fish-meal and fish-oil production.jpg Breka
10:07, 19 October 2010
428 × 230; 13 KB


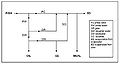
 Flow diagram for the chemical refining of vegetable oils.jpg Breka
09:54, 19 October 2010
348 × 177; 9 KB


