Handbook
Within the project H2020 EUREMnext (2018 - ongoing) the GREENFOODS branch concept was further developed and improved. It can now be used additionally for the sectors metal treatment and manufacture of textiles and is now called ENERGY AUDIT SUPPORT TOOL.
The Energy Audit Support Tool guides the user to identify tailor-made solutions for energy efficient production for SME in different industry sectors by combining technological expertise with knowledge on energy efficiency and renewable resources resulting in clear strategies for SME for process optimization and energy supply towards a production without fossil carbon emissions.
Contents
- 1 Tool Background
- 2 Working with the Energy Audit Support Tool
- 3 Defining the Status Quo - Energy Balancing in the Energy Audit Support Tool
- 3.1 General Input
- 3.2 Energy Sources
- 3.3 Utilities
- 3.4 Distribution
- 3.5 Processes
- 3.5.1 General Handling of Processes
- 3.5.2 Processes in the Food Industry
- 3.5.2.1 Process Heating
- 3.5.2.2 Process Cooling
- 3.5.2.3 Cleaning in Place (CIP)
- 3.5.2.4 Drying (basic)
- 3.5.2.5 Cooling Chamber
- 3.5.2.6 Space Heating and Cooling
- 3.5.2.7 Washing Line
- 3.5.2.8 Black box (simple definition)
- 3.5.2.9 Baking Oven
- 3.5.2.10 Pasteurization
- 3.5.2.11 Evaporation
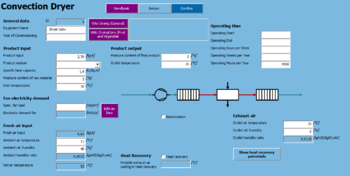
- 3.5.2.12 Convective Dryer (Air)
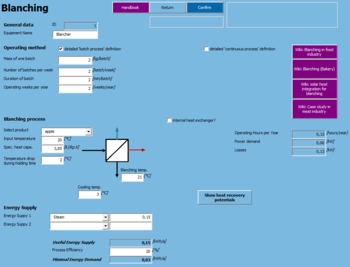
- 3.5.2.13 Blanching
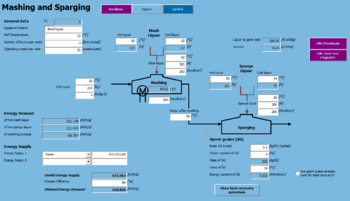
- 3.5.2.14 Brewhouse
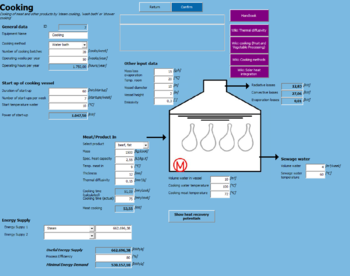
- 3.5.2.15 Cooking
- 3.6 Closing the Energy Balance
- 4 Optimisation
- 5 Export results
- 6 ANNEX A
Tool Background
Project(s) Background
The overall objective of the GREENFOODS project was to lead the European food and beverage industry to high energy efficiency and reduction of fossil carbon emissions in order to ensure and foster the world wide competitiveness, improve the security of energy supply and guarantee the sustainable production in Europe. More information about the GREENFOODS project can be found on the GREENFOODS homepage
The overall objective of the EUREMnext project was to enrich the well-established EUREM European Energy Manager training program, making it available in new countries to allow more persons to become qualified/accredited experts or upgrade their knowledge and skills, and adding ancillary implementation support activities. Thereby contribute to increasing the quality of energy audit results, the probability of implementation of the recommendations, and ultimately the energy efficiency and competitiveness of the businesses. More information about the EUREMnext project can be found on the EUREM homepage
Version
This handbook is designed for the Energy Audit Support Tool 1.0. Here you can find the Download Link: EUREM homepage
Previous versions of the tool have been used for internal (within GREENFOODS project consortia) revision and - later on - for the GREENFOODS training in various countries of the EU.
Working with the Energy Audit Support Tool
Download and Start the Energy Audit Support Tool
The Energy Audit Support Tool is an Excel Tool. Therefore, there is no need to “install” the tool. Make sure you save the file in a directory where you do not need administrator rights. Open the Energy Audit Support Tool with an ordinary double-click on the file. A security warning (see below) may show up and you may need to activate the contents or allow macros to be activated.
A security warning may show up (see below) and you may need to activate the contents or allow macros to be activated.
|
Security warning! Some contents are deactivated. Click here to show details. |
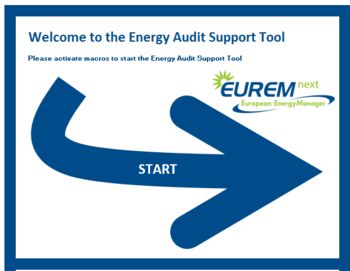
You will see following screen. Start the Energy Audit Support Tool with a click on the blue error.
Selection of a Branch in the Energy Audit Support Tool
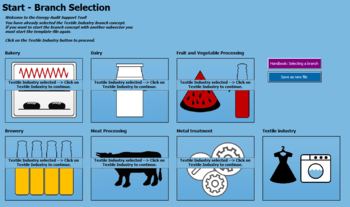
In the Energy Audit Support Tool you can chose between different branches:
- Bakery
- Dairy
- Furit & Vegetable Processing
- Brewery
- Meat Processing
- Metal treatment
- Manufacture of textiles
For starting the branch concept you may select one of them.
|
Once you select a branch you are immediately forced to save the Excel-File as a new version. |
After this initial saving process you will have two versions of the Energy Audit Support Tool:
- Version 1: The original version. It is now closed. No branch is selected. It can be used for new projects.
- Version 2: The current version. It is now open. A branch is selected which cannot be changed in this version.
Additional information on the savings can be found here: Saving
Effects of the branch selections
Choosing one of the branches has the following effects:
- The general input form will be individualized to the selected branch
- The benchmark data is individualized to the selected branch
- The relevant processes are activated for the selected branch
- WikiWeb information (buttons) are individualized
Saving your work
In the following table possibilities to save the Energy Audit Support Tool are shown.
| How to... | |
| ...save as new file | 1) when selecting a branch in Energy Audit Support Tool (Selecting)
2) when clicking “save as new file” in the “branch selection” form |
| ...save changes in a form | by clicking on the (dark green) button “Confirmed” (the changes are saved in the workbook) |
| ...save workbook (Excel-file) | use the common Excel-buttons or the shortcut Strg+S for savings |
FORMS: Entering data in the Energy Audit Support Tool
The graphical user interface of the Energy Audit Support Tool is built in userforms (hereafter called “forms”). By using the buttons explained above, the various forms can be accessed.
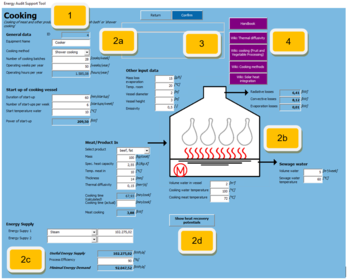
The following figure shows a typical form in the Energy Audit Support Tool (e.g. definition of the process 'cooking').
| Number | Name | Explanation |
|---|---|---|
| 1 | Top bar + Headline | The top bar of the form shows the navigation place of the form (e.g. … > Processes > Cooking)
The headline is supported with additional information on the particular form. |
| 2a | Entry: General | All process-(or utility-)forms will receive a new process-(or utility-)ID. A name must be entered for each process/utility. |
| 2b | Entry: Energy demand | The energy demand of the processes can be calculated in different ways. The calculation is supported by flowsheets or images for better understanding. |
| 2c | Entry: Energy supply | The defined energy demand must be met by energy supply. This section is identical in all process and utility forms.
In utility forms, all energy sources can be selected as energy supply. In process forms, all distribution lines can be selected as energy supply. |
| 2d | Entry: Heat recovery | Heat recovery optimization is an important part of the GF BC. Each provides different heat sinks and heat sources. |
| 23 | Info: Quick | By moving the mouse over fields and images the user gets additional information on the meaning of the field and the required input. |
| 4 | Info: WikiWeb | Most forms have several links to the WikiWeb indicated by purple color. |
|
The X-Button on the top right corner will close the form. The changes of the current form will NOT be saved. However, all previously saved forms will be available for further processing. The user can immediately start the BC again by click on the green start arrow. |
The buttons of the Energy Audit Support Tool have different colors to ease the intuitive navigation in the Energy Audit Support Tool. The table below shows and describes the meanings of the different buttons which can be found in the Energy Audit Support Tool.
FIELDS: color code and mandatory data
The fields are filled with different colors which have different meanings:
| Number | Name | Explanation |
|---|---|---|
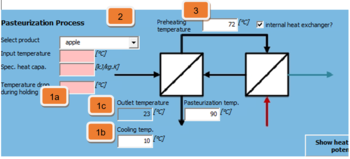
| 1a | Mandatory field (red) | Mandatory fields must be filled in order to start the calculations and save the changes |
| 1b | Filled mandatory fields (white) | As soon as mandatory fields have valid data filled, the color changes to white. However, certain restriction might lead to a recoloring to red again (e.g. invalid temperature differences).
Some fields are white from the beginning, meaning that the entry is not mandatory but optional. |
| 1c | Calculated fields (green) | Green fields are calculated based on the entries in the other fields |
| 2 | Combination boxes (red/white) | Combination boxes allow the selection of pre-defined data. Similar to ordinary fields, they may be mandatory (red) and after selection become white. |
| 3 | Check boxes | In various areas of the different forms, there is the possibility to activate/deactivate additional options. |
Using the Energy Audit Support Tool WikiWeb
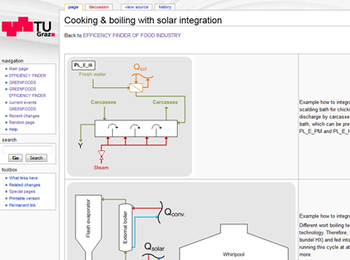
The WikiWeb can be accessed in many multiple areas of the Energy Audit Support Tool, indicated by violet buttons. The WikiWeb gives additonal information to the various processes and optimization possibilities.
 |
→ | 
|
Defining the Status Quo - Energy Balancing in the Energy Audit Support Tool
General Input
In the general input section the following basic data must be entered:
- Ambient Conditions
- Country
- Company Data
- Water Input
- Material Input (branch specific)
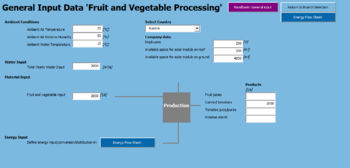
- Energy Input → Linked to the Energy Flow Sheet
The following figure shows the General Input Data: The general part is identical in all 5 subsectors. The branch specific part (material input) is dependent on the branch selection. The flow represents the material, resources and energy input for the production of the food company.
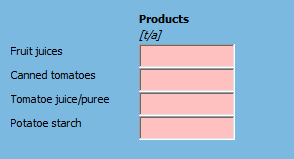
At least one product must be defined in the “material input” section:
Energy Sources
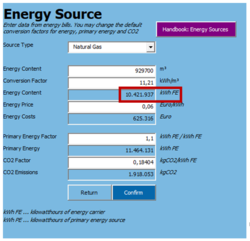
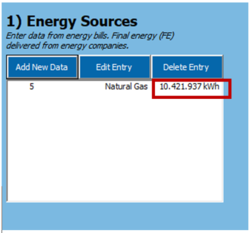
In the Energy Audit Support Tool, 10 energy sources can be selected and a 11th added by the user with individual configurations. The energy value can be entered in typical units for the different energy source types (e.g. natural gas in m³, diesel in litre,...) Via a default but changeable conversion factor the energy value is transferred in kWh.
|
The Energy Audit Support Tool is designed to calculate and display all energy values in kWh. |
 |
→ | 
|
For a detailed economic and ecological analysis of possible optimization measures, following default factors for CO2 and primary energy are used. These values can be changed to account for national differences.
| Energy Source | CO2 | PE Factor |
|---|---|---|
| - | kgCO2/kWh | kWhPE/kWhFE |
| Coal | 0.31 | 1.05 |
| Diesel | 0.25 | 1.10 |
| Fuel Oil | 0.27 | 1.17 |
| LPG | 0.21 | 1.11 |
| Natural Gas | 0.18 | 1.17 |
| Petrol | 0.24 | 1.10 |
| Biomass (wood chips) | - | 1.06 |
| Biogas | - | 1.50 |
| District heat | 0.22 | 0.70 |
| Electricity | 0.19 | 1.00 |
Utilities
Utilities in the Energy Audit Support Tool are technical equipment units that can transform energy sources (such as natural gas, electricity, etc.) to useful energy carriers (suchas steam, hot water, cold, etc.). Following utilites can be defined in the Energy Audit Support Tool branch concept:
- Steam boiler
- Thermal oil boiler
- Hot water boiler
- Chiller
Boilers
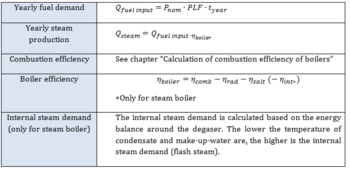
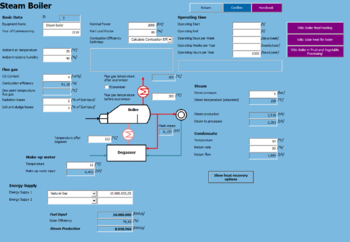
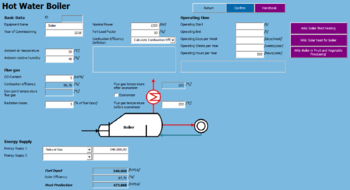
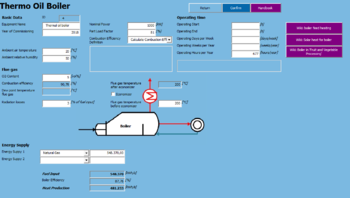
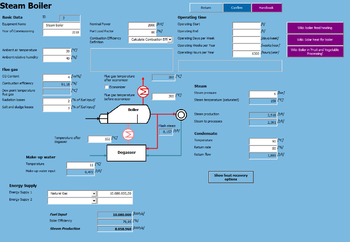
In the Energy Audit Support Tool 3 different boilers can be chosen. All 3 types can be defined with the nominal power, an estimated part load factor with an associated yearly operating time and the boiler efficiency. The boiler efficiency is calculated by summing up the combustion efficiency and the radiation losses (and in case of the steam boiler also a salt and sludge losses). The combustion efficiency may be entered manually (if known by the user) or can be calculated by entering the O2-content and temperature of the flue gas as well as the fuel type (natural gas, diesel, …).
The combustion efficiency is calculated with the formula presented in chapter Calculation of combustion efficiency of boilers. The boiler efficiency is the combination of the combustion efficiency plus heat losses via radiation and salt and sludge losses (see figure below).
Steam Boiler
Hot Water Boiler
Thermo Oil Boiler
Chiller
General description
A compression chiller is a technical equipment that allows the removal of heat from a low temperature level to an higher temperature level via vapor compression. A refrigerant is used as heat carrier liquid that cycles through one heat exchanger that absorbs low temperature heat from another medium that shall be cooled (water, air …). The refrigerant evaporates and is then compressed with the electrically driven compressor. Through this process the refrigerant reaches a higher temperature level, the heat can now be released through another heat exchanger (condenser, e.g. cooling tower) so that the refrigerant condenses again.
Method and formula to calculate cooling energy
The main indicator for the performance of the chiller is the EER (or COP) – Energy Efficiency Ratio, which is the ratio between cooling energy output and electricity input. In the Energy Audit Support Tool there are 2 ways to determine the EER:
- Estimate the EER: The EER can be estimated with the given temperature levels of condensation and evaporation and a typical grade that can be assumed with 50 %. The grade sums up different typical losses within a chiller (e.g. isotropic efficiency of compression, heat losses) and is only a simplification and does not represent a detailed calculation of the EER. However, it serves well as a rule of the thumbs estimation. [1]
- Enter EER manually: The EER is known and can thus be defined by the user.
The cooling demand is determined with the cooling load, the part load factor and the operating hours. The waste heat of the chiller is an important heat recovery possibility especially in the food and drink industry. Thus the condensation heat is automatically saved as potential heat sources in the pinch analysis. It is split in the sensible part (superheated vapor with higher temperature level) and the latent part (condensation heat on lower temperature level).
The formula for the estimation of the EER:
Distribution
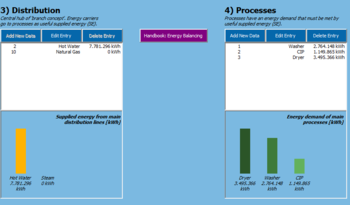
The distribution area in the energy balance sheet of the Energy Audit Support Tool is the central hub for the energy balance in the Energy Audit Support Tool.
- Energy carriers that are produced in utilities are listed here (steam, hot water, thermal oil, cold delivery)
- In case several utilities produce the same energy carrier, the energy content is summed up and listed as one line in the distribution box (several chillers defined in utility -> still one cold delivery in the distribution box)
- The same applies for existing heat recovery from utilities and processes. In case heat recovery is already happening in the case study, then it should not be taken into account in the optimization part, but is represented in the energy balance of the current status quo.
- Energy sources that are not used in utilities are listed in the distribution box. For instance electricity is also needed in processes.
- Distribution types cannot be added or deleted!
- Distribution losses can be edited by selecting the distribution type in the distribution box and then by clicking on ‘Edit Entry’. The distribution loss can be determined by defining a percentage (see figure below)
- The remaining energy content of each distribution type can be selected in the process definition.
- The definition processes and the closing of the energy balance is explained in other chapters.
Processes
General Handling of Processes
The definition of processes is a key element of the Energy Audit Support Tool. Technical equipment (e.g. cooking vessel) and whole production lines (e.g. brewhouse) can be defined. The aim is to depict the actual energy demand of each process and link it with the distribution section and thus close the energy balance (see Closing the Energy Balance)
In the Energy Audit Support Tool the ‘minimal energy demand’ represents indispensable energy demand to fulfill the chemical and/or physical transformation of the process. However, all processes have losses, inefficiencies and technological limitations, thus always more energy must be supplied than actually necessary. The ‘process efficiency’ sums up all inefficiencies and losses of the process in question. The result is the necessary ‘useful energy supply’. This useful energy supply can origin from 3 different sources.
Processes in the Food Industry
Process Heating
Description of process
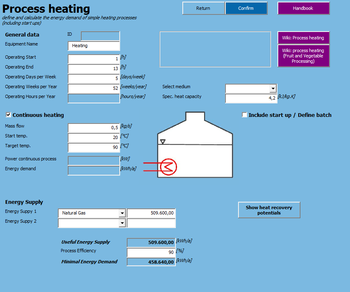
The process heating uses approximately 29% of the total energy used in the food and beverage industry. In this simple heating process the heating is realized by passing the product through a heat exchanger. Depending on the heating process, different methods can be used to achieve energy savings. For example, the re-use of waste water streams of the process for heat recovery is an effective way to reduce the energy consumption. Therefore this process heating also shows the heat recovery potentials. More information about the heating process can be found here: Heating process in food industry
Method of calculating energy demand
The heat demand can be determined either by selecting
- Continuous heating and/or
- Batch heating
If both are selected then the batch heating may serve as a start up definition to determine the required daily or weekly start up energy. Both energy demands are calculated with the mass (flow), the defined spec. heat capacity and the temperature difference.
Process Cooling
Description of process
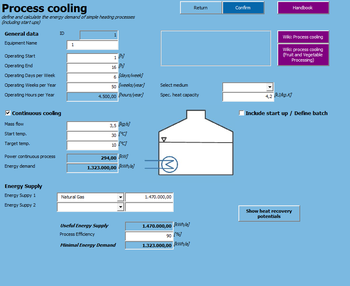
The processes cooling and refrigeration use approximately 16% of the total energy used in the food and beverage industry. The aim of the cooling process is to reduce or maintain the temperature of a product in a lower level. In this simple cooling process the cooling is realized by passing the product through a heat exchanger. More information about cooling can be found here: Cooling processes
Method of calculating energy demand
The cooling demand can be determined either by selecting
- Continuous cooling and/or
- Batch cooling
If both are selected then the batch cooling may serve as a start up definition to determine the required daily or weekly start up energy. Both energy demands are calculated with the mass (flow), the defined spec. heat capacity and the temperature difference. In the current version of the Energy Audit Support Tool it is not possible to define the chiller in the same form but must be defined separately in the utility-area.
Cleaning in Place (CIP)
Description of process
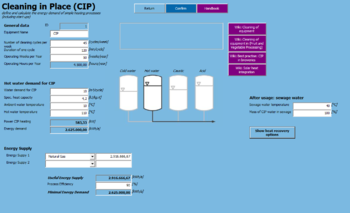
Cleaning in place (CIP) is a commonplace method in the food and beverage industry. CIP allows cleaning the interior surfaces of tanks and pipeline circuits without disassembly. Hereby it is possible that the process plant and pipework is cleaned between the process runs. The main purpose of CIP is to remove solids and bacteria from vessels and pipework to meet the stringent hygiene regulations in the food and drink industry. CIP can be carried out with automated or manual systems.
Method of calculating energy demand
The heat demand for CIP covers only the demand for hot water since it’s mostly the only energy demand for CIP. The heat demand is determined by defining
- The required hot water volume per cycle
- The cold and hot water temperature
- The cp-value of the water (usually 4.2 kJ/kg.K)
Additionally, it is necessary to define the temperature of the water after it has been used (sewage water) and the percentage of the water that is actually gathered. This is needed to determine the potential for heat recovery.
Drying (basic)
Description of process
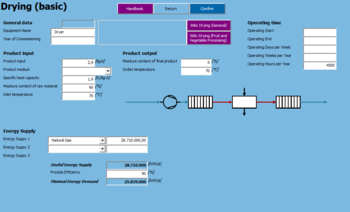
During the drying process water or other liquid is removed from a solid material by evaporation. Usually drying is the final step of operations and the product is ready for packaging and selling. Especially for foods drying is necessary and the most useful operation method to keep foods safe for a long time. For drying food there are a huge number of methods and processes. In this process the inlet and outlet of the gas stream, e.g. air is not considered.
More information about the drying process in the food industry can be found here: Drying process in food industry
Method of calculating energy demand
In the basic version section the product data must be defined:
- Mass flow (kg of dry + wet matter / per second)
- Moisture contents (difference between raw and final product)
- Temperature (in and outlet)
Cooling Chamber
Description of process
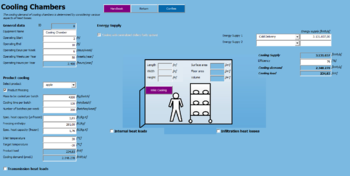
Cooling chambers (see figure below) are main equipment in the food industry. Cooling chambers are used to store food stuff and reduce the temperature of the food from one processing temperature to another or to a required storage temperature. In the cases of chilling, cold stabilization and ageing, the food product should remain in low temperature levels for a period of time. More information about cooling can be found here: Cooling in food industry
Method of calculating energy demand
In the Energy Audit Support Tool the cooling demand is calculated by considering:
- Product cooling (if the product enters the chamber warmer than the target temperature)
- Mass per batch
- Number of batches
- Cooling time per batch
- Is the product only cooled or shall it also be frozen IN the cooling chamber
- Transmission losses (heat entries through the walls)
- Thermal conductivity
- Thickness of insulation
- Temperature difference between cooling room and surrounding area
- Internal heat loads (peoples, fans, bulbs that produce heat within the chamber)
- For each internal heat load type, following is required:
- Load in kW
- Number
- Active hours
- Infiltration losses (heat entries through open doors and fresh (warmer) air inlet)
- Air change rate (how often per hour is the whole air volume of the chamber replaced by fresh air)
- Temperature and relative humidity of fresh air
- Required temperature and relative humidity in the chamber
- Product cooling (if the product enters the chamber warmer than the target temperature)
Activated in following sub-sectors
- Bakery
- Dairy
- Brewery
- Fruit Processing
- Meat Processing
Space Heating and Cooling
Description of process
Production halls and offices have to be heated and increasingly commonly cooled. Space heating and cooling can be done by ordinary radiators, surface heating or ceiling spots. The equipment are supplied with a hot medium, some may be driven electrically. Heating and cooling of production halls and offices can have a high share of the energy demand in less energy intensive production facilities. It can be an important heat sink for waste heat integration.
Method of calculating energy demand
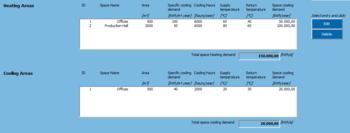
In order to determine the energy demand for heating and cooling the production facilities and offices the area [m²] and specific heating/cooling demand [kWh/m².a] can be entered. Additionally, heating/cooling hours as well as supply and return temperatures are defined so the data can be used as heat sinks and sources in the heat integration analysis.
Multiple areas can be defined which have heating and/or cooling demand. The areas are listed in a heating and a cooling section and can be edited or deleted anytime.
The “total space heating demand” and the “total space cooling demand” require a connection with an energy supply from the distribution list. It is possible to define 3 energy supplies. If both heating and cooling takes place then at least one “heating source” and one “cooling source” must be assigned, additionally a third source (either heating or cooling) may be selected.
Formula to determine energy demand
Where:
| Formular | Description | Unit |
|---|---|---|
| Q | Energy demand | [kWh/a] |
| qi | Specific energy demand of space | [kWh/a.m²] |
| Ai | Area of space | [m²] |
| i | space Number |
Embedding in branch concept
- The energy supply may be split into heating and cooling sources
- Space heating is an important heat sink for heat recovery measures in many cases. It is added as a cold stream in the heat recovery analysis. The extracted heat from cooled spaces can technically serves as heat source for heat recovery or heat pumps, but it is not likely to be actually used. However, it is still included in the stream list as hot stream.
Washing Line
Description of process
In several food industries, bottles and cases are used when packaging final products. The bottles and cases are in direct contact with the food and therefore they must be cleaned sufficiently before they are used. During the cleaning process possible food residues, dirt and odors from the packaging containers are removed. Thereby the microbiological load is minimized according to hygiene and health regulations. For the cleaning process high temperature water is necessary.
Method of calculating energy demand
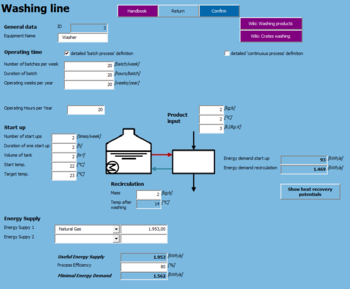
This washing line definition is specifically created for following case: A storage tank with cleaning water is heated up a number of times a week (start up). The cleaning water is used to clean a product that enters a cleaning chamber with a definable temperature. The cleaning water recirculates to the storage tank with a lower temperature due to the colder product input.
Heat demand for:
- Start up
- Number of start ups
- Duration of start up (only for heat recovery)
- Volume of tank
- Temperature difference
- Recirculation
- Product input data
- Recirculation mass flow
- Start up
Black box (simple definition)
Description of process
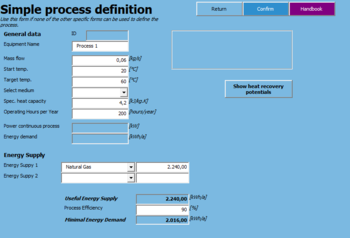
The black box can be used if there is no other specific form which can define the process. The energy demand is calculated simply by the mass of the incoming product as well as the start and target temperature, the heat capacity and the operating hours of the process.
Method of calculating energy demand
The energy demand is simply calculated with:
- Mass flow
- Temperature difference
- CP-value (of a given set of food)
- Operating time
Baking Oven
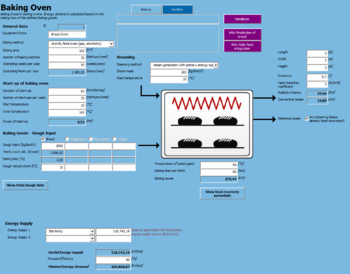
Description of process
The baking process transforms an unpalatable dough into a light, readily digestible, porous flavourful product. The physical activities involved in this conversion are complex but the fundamentals of these are explained here: Information about bread The internal loaf temperature increases to reach approximately 98°C. The loaf is not completely baked until this internal temperature is reached. Weight is lost by evaporation of moisture and alcohol from the crust and interior of the loaf. Steam is produced because the loaf surface reaches 100°C+. As the moisture is driven off, the crust heats up and eventually reaches the same temperature as the oven.
Method of calculating energy demand
The unit operation “baking” is related to the drying operation. The process involves the evaporation of water in the dough which is known as the baking loss.
|
The baking loss is the ratio between water loss during baking and dough input. |
Additionally, at the beginning of the baking process steam is supplied to the baking oven for better heat conductivity of the baking goods. If the required steam is generated by the baking oven itself (e.g. internal electrical steam generator) then the necessary energy demand is calculated. If, however, steam is supplied directly from a stream distribution line, then the respective amount of energy must be assigned in the energy supply section.
The heating of the cold dough is also considered in the energy demand.
For the startup of the oven only the heating of the air is considered, but not the heating of oven-material.
Heat losses are comprised of radiative and conductive heat losses.
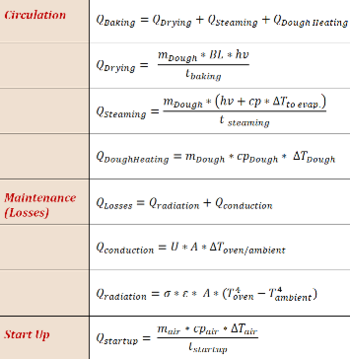
Formula to determine energy demand
Where:
| Formular | Description | Unit |
|---|---|---|
| QBaking oven | Baking Power | [kW] |
| mDough | Mass input of dough | [kg/batch] |
| BL | Baking Loss | [kgWater/ kgDough] |
| hv | Evaporation enthalpy water | [kJ / kg water] |
Embedding in branch concept
- The total dough input of 4 baking goods can be defined in the General Input form. The definition of the baking loss is also defined there.
- The energy supply is likely to come from different sources (e.g. thermo-oil for baking power, steam inlet for steaming, electricity for lighting)
- The usage of the remaining vapors (from the steaming) for heat recovery is a key energy efficiency measure in bakeries. The condensation enthalpy of the steam is added to the pinch stream list. Currently, only the condensation enthalpy at 100°C is considered in pinch analysis.
Pasteurization
Description of process
Pasteurisation is a controlled heating process used to eliminate any dangerous pathogens that may be present in milk, fruit-based drinks, some meat products, and other foods which are commonly subjected to this treatment. Pasteurization inactivates most viable vegetative forms of micro-organisms but not heat-resistant spores. As well as the application to inactivate bacteria, pasteurization may be considered in relation to enzymes present in the food, which can be inactivated by heat. Pasteurisation is used to treat all types of food products. These include milk, juices, beer and many others. More information about pasteurization can be found here: Pasteurization in food industry
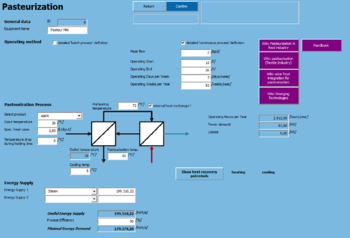
Method of calculating energy demand In order to calculate the energy demand of pasteurization, the user has 4 options:
- Batch process with no internal heat exchanger
- Continuous process with no internal heat exchanger
- Batch process with internal heat exchanger
- Continuous process with internal heat exchanger
Energy is needed to heat up the medium to the pasteurization temperature and hold it for several seconds or minutes.
Formula to determine energy demand
Embedding in branch concept
- For heat recovery the heating of the product is added as a pinch stream (if there is already an internal heat exchanger the remaining heat demand is added). Similarly, the cooling of the product after pasteurization is also added as a pinch stream.
- All available energy sources can supply to this process
- Additional information on emerging technologies in this area is available in the WikiWeb.
Evaporation
Description of process
Evaporation is the partial removal of water from liquid food by boiling. For instance, liquid products can be concentrated from 5 % dry solids to 72 %, or even higher, depending on the viscosity of the concentrates. Evaporation is used to pre-concentrate food, to increase the solid content of food, to change the colour of food and to reduce the water content of a liquid product almost completely, e.g. as in edible oil drying.
More information about evaporation can be found here: Evaporation in food industry
Method of calculating energy demand
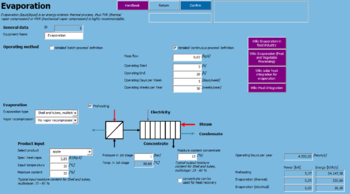
The energy demand for evaporation is highly dependent on the number of evaporation stages and the vapor recompression technology. The evaporation can be driven by steam or electricity. Depending on the recompression technology, additional steam or electricity is needed. In case of TVR (thermal vapor recompression), the thermal heat demand is higher and it is process-relevant that steam is used as thermal heat carrier. In case of MVR (mechanical vapor recompression) electricity is needed increase the pressure and thus increasing the temperature for further use in the evaporation stages. The dependencies of the multi-stage process depends on several factors, thus literature values are used: [2]
| [kWh/kg water evaporation] | Total | Steam | El |
|---|---|---|---|
| No vapor recompression | 0,66 | 0,61 | 0,05 |
| TVR 1 | 0,31 | 0,28 | 0,02 |
| TVR 2 | 0,15 | 0,14 | 0,01 |
| TVR 3 | 0,10 | 0,09 | 0,01 |
| TVR 4 | 0,08 | 0,07 | 0,01 |
| TVR 5 | 0,06 | 0,06 | 0,00 |
| TVR 6 | 0,05 | 0,05 | 0,00 |
| TVR 7 | 0,04 | 0,04 | 0,00 |
| MVR -new | 0,02 | 0,00 | 0,01 |
Formula to determine energy demand
The formula for the determination of the energy demand can be seen in the following table:
Where:
| Formular | Description | Unit |
|---|---|---|
| Qevaporation | Necessary power for evaporation | [kW] |
| mproduct | Mass input of product | [kgproduct/s] |
| cpproduct | Specific heat capacity of product | [kJ/kg.K] |
| Tin | Inlet temperature of product | [°C] |
| T1st stage | Temperature before evaporation is the boiling temperature depending on the defined pressure p1st stage | [°C] |
| ML | Moisture loss (difference of input and output moisture content) | [kg water / kg product] |
| qspecific evap. | Specific energy demand for evaporation depending on table above | [kWh/ kg water] |
| toperating | Operating time | [hours/year] |
Embedding in branch concept
- Heat recovery:
- The preheating of the product is added as a heat sink to the stream list
- For the evaporation following assumption are made in order to include the evaporation to the stream list:
- Temperature of the 1st stage is used for all stages
- Since evaporation takes place at boiling temperature the “target temperature” is defined as 1 Kelvin above boiling temperature
- Only the thermal demand is used
- The concentrate can individually be included as heat source. The concentrate temperature after leaving the evaporator must be entered.:**The condensate is not included in the stream list
- All available energy sources can supply to this process. However, steam and electricity are the only suitable energy sources for evaporation.
- Additional information on heat integration is available in the WikiWeb.
- Heat recovery:
Convective Dryer (Air)
Description of process
During the drying process water or other liquid is removed from a solid material by evaporation. Usually drying is the final step of operations and the product is ready for packaging and selling. Especially for foods drying is necessary and the most useful operation method to keep foods safe for a long time. For drying food there are a huge number of methods and processes. In this process the inlet and outlet of the gas stream, e.g. air is not considered.
Method of calculating energy demand
In the first section of the form, the product data must be defined.
- Mass flow (kg of dry + wet matter / per second)
- Moisture contents (difference between raw and final product)
- Temperature (in and outlet)
The mass flow and the moisture difference determines the mass of moisture that must be removed by the air dryer. The mass flow and the temperature difference determines the amount of thermal energy that is used (or lost) for heating up the product during the drying process. In the second section of the form, the air data is defined:
- Temperature and relative humidity of fresh air
- Temperature and relative humidity of exhaust air
These parameters define the condition of the fresh and exhaust air and its ability of taking up moisture from the product. Based on that, the required amount of air mass is calculated that is needed to take up the moisture from the product. Subsequently, the drying temperature is calculated. It must be noted that this approach is ideal in cases when an energy audit is made where the mentioned parameters can be measured easily. Air mass and drying temperature are less likely to be measured, however they might be known by the technical operator.
Blanching
Description of process
Blanching is a food-oriented unit operation. Blanching operations are designed to expose the entire product to high temperatures for a short period of time, by using steam heating indirectly for fruit juices and directly for vegetables. The primary function of this operation is to inactivate or retard bacterial and enzyme action, which could otherwise cause rapid degeneration of quality.
More information about blanching can be found here: Blanching in food industry
Method of calculating energy demand
The blanching process is similary defined like the Pasteurization process.
Brewhouse
Description of process
The brewing process of beer consists of three basic steps: Mashing, fermentation and maturation/conditioning. During the mashing process milled grains and water are heated. Thereby enzymes in the malt break down the starch in the grain into sugars to create a malty liquid called wort. Mashing takes place at a temperature level of 50 – 75°C. Sparging is also called lautering and separates the wort from the grains. This is done in a lauter tun, mash tun or in a lauter filter. The temperature level is about 75° C.
More information about the brewing process can be found here: Brewhouse
Method of calculating energy demand
The brewhouse is separated in two sections:
- Mashing and sparging
- Wort cooking
In the mashing and sparging section the required thermal energy demand is calculated as following:
- Hot mash liquor
The hot mash liquor is – in most cases – a mixture of hot and cold water since the hot water is available from wort cooling heat recovery. The required energy demand is defined by:
- Mash liquor temperature
- Reference temperature
- Volume per brew
- Number of brews
- Hot sparge liquor
The same applies to hot sparge liquor
- Mashing process
The thermal energy for the mashing processes (heating the mash in the vessel) is determined by
- The masses of mash and mash liquor
- The required temperature after mashing
- The mixture temperature of mash and mash liquor
- The mixture specific heat capacity of mash and mash liquor
Cooking
Description of process
Cooking is a heat processing technic for making food edible. Furthermore cooking also changes the texture, colour and moisture of the food. There are different methods of cooking e.g. water bath, shower and steam. Water bath ovens allow the best homogeneity of heating to be obtained. The immersion into hot water causes weight loss which and results that proteins and greases are released into the water. A shower oven allows a good uniformity of heating. It includes the simultaneous action of water sent through the shower and the saturated steam which rises from the collecting basin, at the bottom of the oven, which is heated, in turn, by coils. Hot air ovens are able to control the surface humidity if necessary and include a steam inlet and a recirculation of hot air which is obtained by passage of through heat-exchanger. More information about cooking can be found here: Cooking in food industry
Method of calculating energy demand
The energy demand for the ‘cooking’ process consists of following parts:
- Energy demand for heating up the water in the vessel
- Energy demand for heating up the cold meat entering in the vessel
- Energy demand that substitutes radiative and convective energy losses
Closing the Energy Balance
A main feature of the Energy Audit Support Tool is the support of the user in closing the energy balance. This means that all input and output energy flows must fit together. Varying efficiencies, running hours and part load factors as well as missing processes are the most likely reasons for an inconsistent energy balance. The user is supported with following views:
View "Flows"
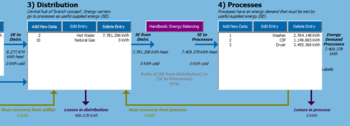
In this view the flow, transformation and usage of the energy sources is shown. The first 3 sections (sources, utilities, distribution) is also explained in chapter Distribution. The supplied energy (SE) as shown in the distribution-box must fit to the energy demands that have been defined in section ‘processes’. The percentage ‘Ratio of [SE from distribution] to [SE to processes]’ must be 100% for a closed energy balance. If the ratio is not 100% following steps may be taken
- Not all processes have yet been considered.
- Efficiencies of utilities and processes are too high or low
- Distribution losses are higher or lower than expected.
- Running hours of utilities and processes are lower or higher than expected
- Part load factors of utilities and processes are lower or higher than expected
View "Balance"
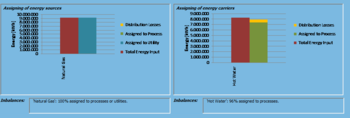
This view is a further assistance-tool for the user and can be seen as an extension to view “Flow” and its ‘Ratio of [SE from distribution] to [SE to processes]’. In the two charts below the energy balance is done not only for the whole company but for each energy source (chart left) and for each energy carrier in the distribution box (chart right). In other words: If natural gas is defined as an energy source (like in the example below), then the same amount of energy must be assigned to utilities, processes or distribution losses. If 100% of the natural gas is used in a hot water boiler to create hot water, then the balance for natural gas is closed and the two bars have the same height. In consequence, the hot water appears as an energy carrier in the right chart. Part of it is applied to the 3 processes as seen in the view ‘flow’ screenshot above. A small amount of energy is accounted as distribution losses. However, not all of the produced hot water could be assigned. One of the reasons above (listed in view ‘flow’). For instance
- one or several processes run more inefficient as expected
- one process is missing
- more distribution losses as expected
- the hot water boiler is less efficient, thus less hot water is produced
View "Charts"
This view shows the 3 main equipments/sources of each category (source, utility, distribution, process).
Optimisation
Benchmark Analysis
Process Optimisation
A vast variety of process optimization recommendations can be acquired in the respective section of the WikiWeb: Energy efficiency in fruits/vegetables/herbs
System Optimisation
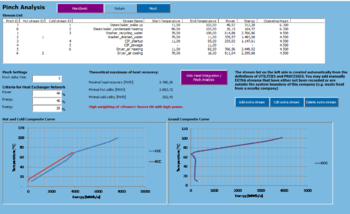
For the system optimization of the company under investigation the Energy Audit Support Tool has incorporated a Pinch Analysis, which is a methodical approach of identifying heat recovery potentials and setting up a heat recovery network.
For Pinch Analysis it is necessary to retrieve all possible thermal energy streams that must be either heated up (=cold streams) or can/must be cooled down (=hot streams).The summary of these streams is called the pinch stream list.
There are 2 ways to get the data for the pinch stream list:
- The Energy Audit Support Tool automatically retrieves the data of hot and cold streams from the process and utility definitions while setting up the energy balance of the status quo.
- In the Pinch Analysis Form, the user can add extra streams that are not considered in the energy balance before.
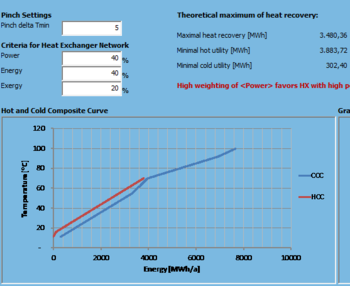
Via vectorial addition, all hot streams are combined to the “hot composite curve” = (HCC) and all cold streams are combined to the “cold composite curve” = (CCC). It is important to note that the Pinch Curves show only the process and extra streams but not the utility streams.
| Input field | Explanation |
|---|---|
| Pinch dTmin | Minimal temperature difference of heat exchangers in the heat recovery network to transfer heat from the hot side to the cold side.
Thus, the HCC must have the same distance to the CCC at the narrowest point. This point is called the Pinch which gives this method its name. |
| Criteria for Heat Exchanger Network | The 3 criteria must sum up to 100%. They determine the ranking of suggested heat exchangers in the next form. |
| Power | HX with high thermal power [kW] are favored. |
| Energy | HX with high energy transfer [MWh] are favored. |
| Exergy | HX with little temperature difference between hot inlet and cold outlet are favored. |
| Maximal heat recovery | Theoretical maximum of heat recovery at given deltaTmin. |
| Minimal hot utility | Theoretical minimum of hot utility if all heat recovery potentials are exploited. |
| Minimal coldutility | Theoretical minimum of cold utility if all heat recovery potentials are exploited. |
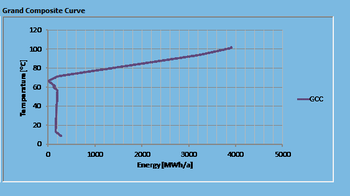
The Grand Composite Curves (figure below) gives better insights in the placement of utilities and the actual required temperature level of the processes.
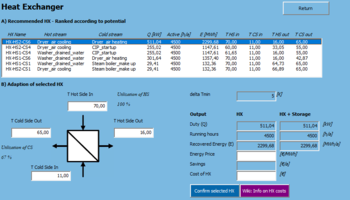
In the listbox Recommended HX all possible heat exchangers are listed, but ranked according to their potential. Please note the following:
- The HX Name is comprised the following way to understand its origin:
- HX...Heat Exchanger
- HS#...Hot Stream + Hot Stream ID (see form before)
- CS#...Cold Stream + ColdStream ID (see form before)
- The minimal temperature difference (delta Tmin) for heat exchangers is fixed with the value from the first form.
- The section “HX + Storage” (see figure below) gives indication on the possible increase of recovered energy by including puffer storage and thus achieve longer active hours of the heat exchanger.
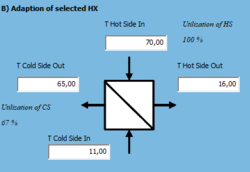
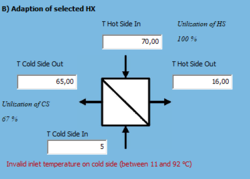
The following figures show exemplarily how the 4 temperatures of the heat exchanger can be changed. Note that the delta Tmin and mass flows cannot be adapted. Following rules apply for the heat exchanger:
- T Hot Side In > T Cold Side Out + delta T min. The hot inlet must be at least e.g. 5 Kelvin warmer than the cold outlet
- T Hot Side In > T Cold Side Out + delta T min. The hot outlet must be at least e.g. 5 Kelvin warmer than the cold inlet
- Both sides (hot and cold) are limited by the defined temperature range given from the pinch stream list.
 |
→ | 
|
By entering “energy price” and “cost of HX” (with the help of the EFFICIENCY FINDER) the HX can be confirmed. At the same time the recommended HX list is updated. If the whole temperature range of the hot and cold stream is used then the stream will naturally not be available anymore for further HXs. If, however, only a part of the temperature range is used, then the remaining parts can still be used for other combinations. This is necessary, if e.g. only one major hot waste stream is available which could be linked to various heat sinks (cold streams). Streams with remaining temperature ranges are marked with the prefix “SplitLow” or “SplitHigh”.
Integration of Renewables
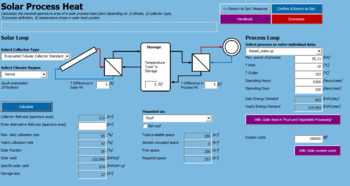
Solar Thermal Heat for Industrial Processes
| Number | Name | Explanation |
|---|---|---|
| 1 | Process Loop | Cold streams can be selected in the combination box (thermal power, temperatures and operating hours are loaded in the fields below) |
| 2 | Solar Loop and Solar Storage | In order to provide heat to the selected process, different climate regions and temperature drops in the supply network can be defined.
4 different collector types can be compared. |
| 3 | System performance | After clicking the ’Calculate’ button the collector fields size and the required mounting area (besides other key solar performance indicators) are calculated. The required mounting area is compared with the available space defined in the General Input form |
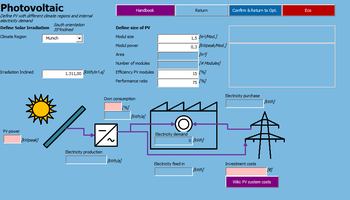
Photovoltaic
| Number | Name | Explanation |
|---|---|---|
| 1 | Define Climate Region | The inclined irradiation of the selected climate region is automatically generated. It may be adapted by the user for specific regional or inclination settings. |
| 2 | Define PV system | Typical module configurations can be entered. Information on typical values is given in the Info-box on the right hand side. |
| 3 | Define PV integration | The PV power can be varied and its effect on the company examined. The electricity demand is compared with the new PV system. |
| 4 | PV system costs | Information on typical PV system costs is given in the WikiWeb. In the Economic Analysis the whole electricity generated by the PV system is taken into account. |
Biogas
Biogas is an important potential for renewable energy production in the food and drink industry. Further details on biogas production can be found here: Bioenergy in fruits/vegetables/herbs production
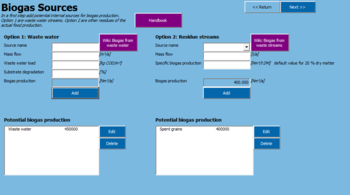
Step 1: Biogas Sources There are 2 different types of biogas sources: Option 1: waste water
| Input field | Explanation |
|---|---|
| Mass flow | Mass flow of the waste water stream |
| Waste water load | The COD (chemical oxygen demand) of the waste water must be entered |
| Substrate degradation | Percentage of the utilization of the COD potential |
For more information see: Biogas from waste water
Option 2: residue streams
| Input field | Explanation |
|---|---|
| Mass flow | Yearly mass flow of the biogas source material |
| Specific biogas production | Biogas production per ton of dry material (DM) – default values are given when choosing a source |
Also have a look at Table 8 in following link: Biogas from waste streams
In the screenshot below can be seen how the biogas production of the two possible sources (1 and 2) is summed up and is ready for further editing (3).
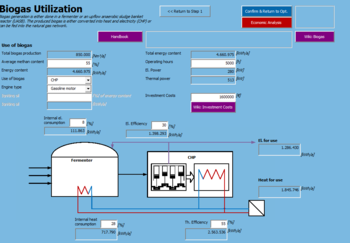
Step 2: Biogas Utilization
Key rule of the thumbs values can be found here in German
or here in English
| Number | Name | Explanation |
|---|---|---|
| 1 | Amount of biogas | The total biogas production origins from the first step (biogas sources). Here, the ‘average methan content’ must be entered which is usually between 53-67 % as indicated in the info-box. |
| 2 | Biogas utilization | In the ‘use of biogas’ box only CHP can currently be selected. Biogas feed-in would be another method which can currently not be examined.
The engine type can also be selected. The igniting beam engine needs an additional energy source. |
| 3 | CHP definition | In the CHP flow sheet the thermal and electrical efficiency must be entered as well as the internal energy demand for the fermenter. Information on typical values is given for all fields. |
| 4 | Power and operating hours | The operating hours of the CHP must be entered. Electrical and thermal power of the CHP is calculated. |
| 5 | Investment costs | Based on the electrical power, the investment costs for the biogas fermenter + CHP can be estimated with the help of the WikiWeb |
Biomass CHP
In order to fulfill the target of going toward zero-fossil fuels in the food and drink industry, only biomass CHPs can be examined in the Energy Audit Support Tool and not natural gas CHPs which are generally also considered as an efficiency improvement, however still based on fossil fuels.
More information on biomass CHP in industries can be found here: Bioenergy in fruits/vegetables/herbs production
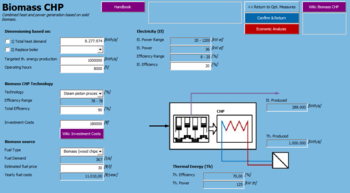
| Number | Name | Explanation |
|---|---|---|
| 1 | Dimensioning of biomass CHP | The biomass CHP can be dimensioned in 3 ways:
Option 1: Based on the total heat demand Option 2: Based on the replacement of one existing boiler Option 3: By entering an individual targeted thermal energy production |
| 2a + 2b | Biomass CHP technology | 8 different biomass CHP technologies can be selected. Some are in an experimental stadium, some have proven their applicability in practice. Depending on the selection, efficiency and power ranges are given. The user must enter the exact values manually. |
| 3 | Investment costs | The investment costs are given for each technology in the WikiWeb |
| 4 | Biomass source | Wood chips are the default biomass fuel type. The fuel demand is calculated automatically with an energy content of 3.89 kWh/kg |
| 5 | Energy generation | The produced thermal and electrical energy production is calculated based on the efficiencies, the targeted energy production and the operating hours. |
Heat Pump
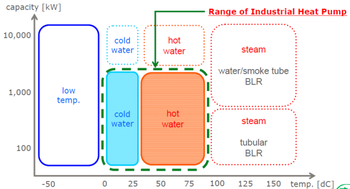
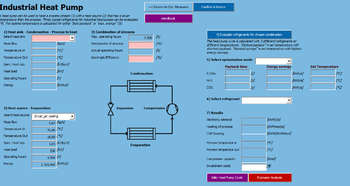
The heat pump module helps us decide if to use a heat pump to lift the temperature of a heat flow to heat up another heat flow. A low temperature waste heat flow can be upgraded to useful high temperature heat with the use of a heat pump. The mechanical heat pump type is the most commonly used. Its principle is based on compression and expansion of a refrigerant.
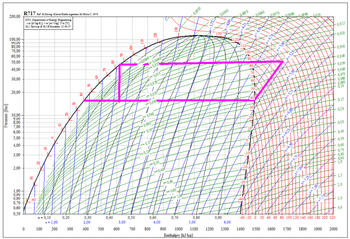
For large scale industrial applications, Ammonia is the most suitable refrigerant for heat pumps that deliver heat up to a temperature of 90 °C. Ammonia is considered to be one of the most efficient refrigerants. However its use comes with certain safety measures. Therefore Ammonia is mainly used for large industrial installations. The choice of refrigerant for a certain application is determined by the temperature range of its thermodynamic cycle and the size of the installation needed. Refrigerants can be divided into two groups: natural refrigerants (Butane, Ammonia, CO2) and synthetic refrigerants (R134A, R407C, R410A). For commercial applications synthetic refrigerants are favoured over natural ones. A disadvantage of synthetic refrigerants is their strong contribution to the greenhouse effect in case of leakage. The negative impact of synthetic refrigerants is, for example, 1300-2100 times higher compared to CO2.
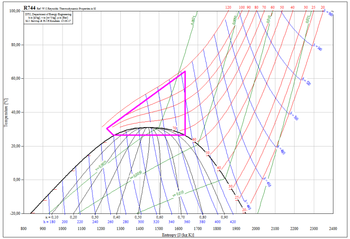
In this tool, we will analyze 3 refrigerants: Ammonia (R717), R134 and CO2 (R744). Although new refrigerants are starting to be used with good performances (R245a), they are still not widely spread, and thus we will limit ourselves in the tool to the three forementioned. The tool will allow the introduction of new refrigerants, either transcritical or non-transcritical.
Image from Kobelco, industrial heat pump manufacturers
The analysis of the potential of the heat pump in the tool is done using a userform that recovers the data from the different energy flows.
In the left part of the screen, the 1) heat sink (where we will send the heat to) and the 2) heat source (where we will get the heat from) must be selected from the combo lists.
In 3) , we will introduce the percentage of hours where the heat sink and the heat source are operating at the same time. If no simultaneity exists between the flows, the number must be 0. If complete simultaneity exists, it must be 100.
In point 4), a first analysis, based on real life installations (more references in Wiki Heat Pump Costs) is done, to evaluate for the given processes which is the most interesting heat pump refrigerant. Two optimization indicators can be used, either maximum energy recovery or optimum payback.
Once we have seen the results, we select a refrigerant, and the calculation is done, to evaluate the COP, the energy recovery and, given the investment costs we introduce, a payback.
Limits are established as for temperatures.
- R717 and R134 cannot go higher than 90ºC
- For CO2 heat pumps, for a high temperature lift at the side of the gascooler (at least 30-40 °C) and a low temperature of the water that needs to be heated, the efficiency of a CO2 transcritical heat pump can be higher than conventional heat pumps. If the return temperature is higher than 30ºC, it cannot be used.
Economic Evaluation
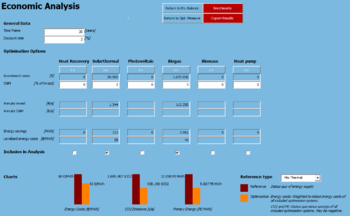
' All optimization measures (system optimization or the integration of renewable energy) can be economically evaluated in the ECONOMICS section which is marked with this red button:
Where:
| Formular | Description |
|---|---|
| LCOE | Levelized cost of electricity |
| It | Investment expenditures in the year t |
| Mt | Operations and maintenance expenditures in the year t |
| Et | Fuel expenditures in the year t |
| r | Discount rate |
| n | Time frame |
| Number | Name | Explanation |
|---|---|---|
| 1a | General Data - Time frame and discount rate | Time frame and discount rate are uniform for all optimization options below. |
| 1b | General Data - Reference | In the dropdown-menu the reference-basis can be selected by which the optimization options shall be compared.
For instance: If only photovoltaic is selected as optimization option then the reference Electrical shall be selected. If only thermal savings are achieved (e.g. solar thermal + heat recovery) then the reference Mix Thermal shall be selected. The reference combines all fuel energy sources (e.g. natural gas, biomass, etc.) |
| 2 | Optimization Options | The 6 optimization options must be defined in their respective userforms: |
Export results
Export Report
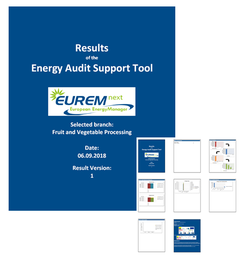
The results of the Energy Audit Support Tool are exported as PDF.
|
ANNEX A
Emissivity of technical surfaces
| Catogory | Surface | Emissivity |
|---|---|---|
| metal | silver, polished | 0.03 |
| metal | copper, polished | 0.04 |
| metal | copper, black oxidized | 0.82 |
| metal | aluminium, bright rolled | 0.05 |
| metal | iron, bright etched | 0.16 |
| metal | iron, sanded | 0.26 |
| metal | iron, heavily corroded | 0.85 |
| other | glas | 0.88 |
| other | linoleum | 0.88 |
| other | paper | 0.89 |
| other | wood | 0.91 |
| other | mortar, plaster, concrete | 0.93 |
| other | brick | 0.93 |
| other | roofing felt | 0.93 |
| coating | aluminium-bronze coating | 0.40 |
| coating | oil paint coating, black, matte | 0.97 |
| coating | oil paint coating, black, bright | 0.88 |
| coating | oil paint coating, white | 0.89 |
| coating | radiator coating | 0.93 |
Calculation of combustion efficiency of boilers
The combustion efficiency of the boilers in the Energy Audit Support Tool is calculated with following formula:
Where:
| Formular | Description |
|---|---|
| nf | Bioler efficiency |
| qA | Exhaust gas losses |
| tA | Exhaust gas temperature |
| tL | Combustion air temperature |
| O2 | Measured O2 content |
| A | Fuel specific factor (see table below) |
| B | Fuel specific factor (see table below) |
In order to calculate the combustion efficiency according to the formula above one must enter the flue gas temperature, oxygen-value after combustion and the combustion air temperature additionally to the fuel-specific values A and B according to the table below.
| Fuel | Fuel specific factor A | Fuel specific factor B |
|---|---|---|
| Coal | 0,6967 | 0,0061 |
| Diesel | 0,6687 | 0,0079 |
| Fuel Oil | 0,6687 | 0,0079 |
| LPG | 0,6440 | 0,0111 |
| Natural Gas | 0,6440 | 0,0111 |
| Petrol | 0,6687 | 0,0079 |
| Biomass (wood chips) | 0,6824 | 0,0125 |
| Biogas | 0,6440 | 0,0111 |
| Districht heat | - | - |
| Electricity | - | - |
